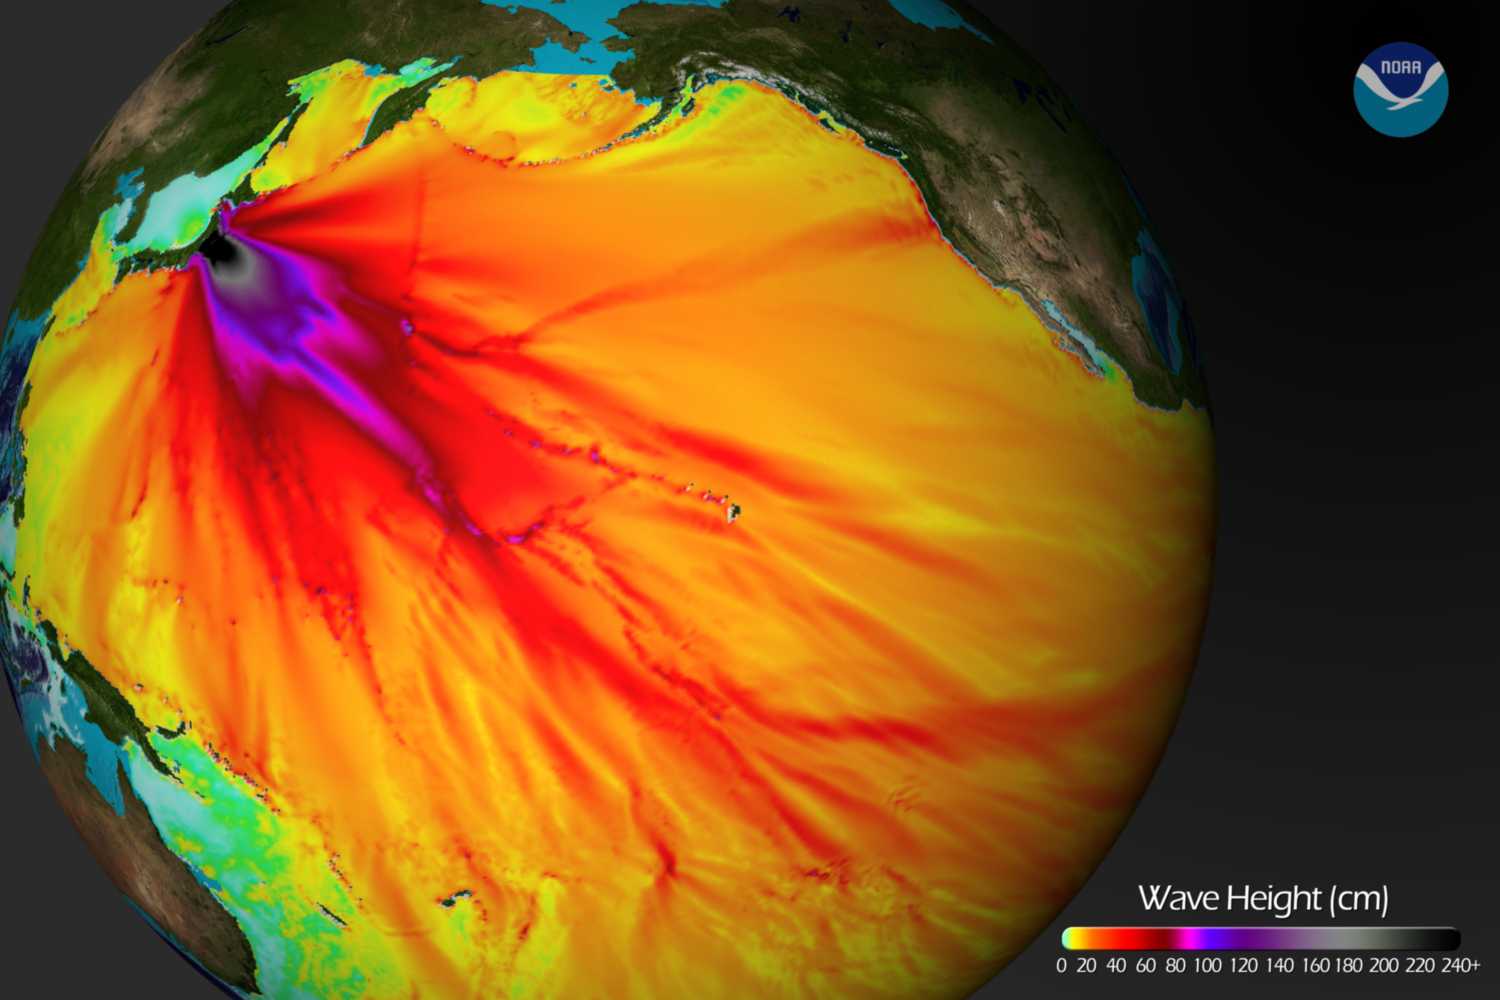
The Honshu tsunami was generated by a Mw 8.9 earthquake (38.322°N, 142.369°E ), at 05:46 UTC, 130 km (80 miles) E of Sendai, Honshu, Japan (according to the USGS). In approximately 25 minutes, the tsunami was first recorded at DART® buoy 21418. Forecast results shown below were created with the NOAA forecast method using MOST model with the tsunami source inferred from DART® data.

| The graphics display forecast results, showing qualitative and quantitative information about the tsunami, including tsunami wave interaction with ocean floor bathymetric features, and neighboring coastlines. Tsunami model amplitude information is shown color-coded according the scale bar.
Modeling Results
|
Model and DART® buoy data / tide gage data comparison
- Comparison of the March 11, 2011 Honshu tsunami recorded at sea-level gages in the Pacific
and along U.S. coastlines with forecasts obtained from high-resolution forecast model runs.
The forecast models were run in real time before the tsunami reached the locations shown.
The model data for Hawaii and the U.S. West Coast show 6 to 9 minute early arrival (less than
1.5% error accumulated during the propagation simulation). The plots show model data for
those locations with time shifted later for the comparison purposes. (see References, below). - Forecast results comparison with sea level data composite plots:
- U.S. West Coast
- Alaska
- Hawaii and Oceania
- Comparison of model data with DART® data
References:
Tang, L., V. V. Titov, and C. D. Chamberlin (2009), Development, testing, and applications of site-specific tsunami inundation models for real-time forecasting, J. Geophys. Res., 114, C12025, doi:10.1029/2009JC005476. [PDF version ]
Titov, V.V. (2009): Tsunami forecasting. Chapter 12 in The Sea, Volume 15: Tsunamis, Harvard University Press, Cambridge, MA and London, England, 371–400.
Wei, Y., E. Bernard, L. Tang, R. Weiss, V. Titov, C. Moore, M. Spillane, M. Hopkins, and U. Kânoğlu (2008): Real-time experimental forecast of the Peruvian tsunami of August 2007 for U.S. coastlines. Geophys. Res. Lett., 35, L04609, doi: 10.1029/2007GL032250. [PDF Version]
Disclaimer: These modeling results are based on a preliminary tsunami source definition and preliminary bathymetric and topographic data that is not fully verified and has known inaccuracies. Therefore the model results are subject to revision.
